Data Editor
Free Visme Tutorials/Download PDF and FlipBooks
● On the ‘Data Editor’ tab, there are additional features you can select for displaying the data in the
form of a chart, graph, map, and so on.

● Charts and Graphs: Use the available types of charts, including bar, pie, donut, line, combo,
and others, depending on the data that you want to illustrate.
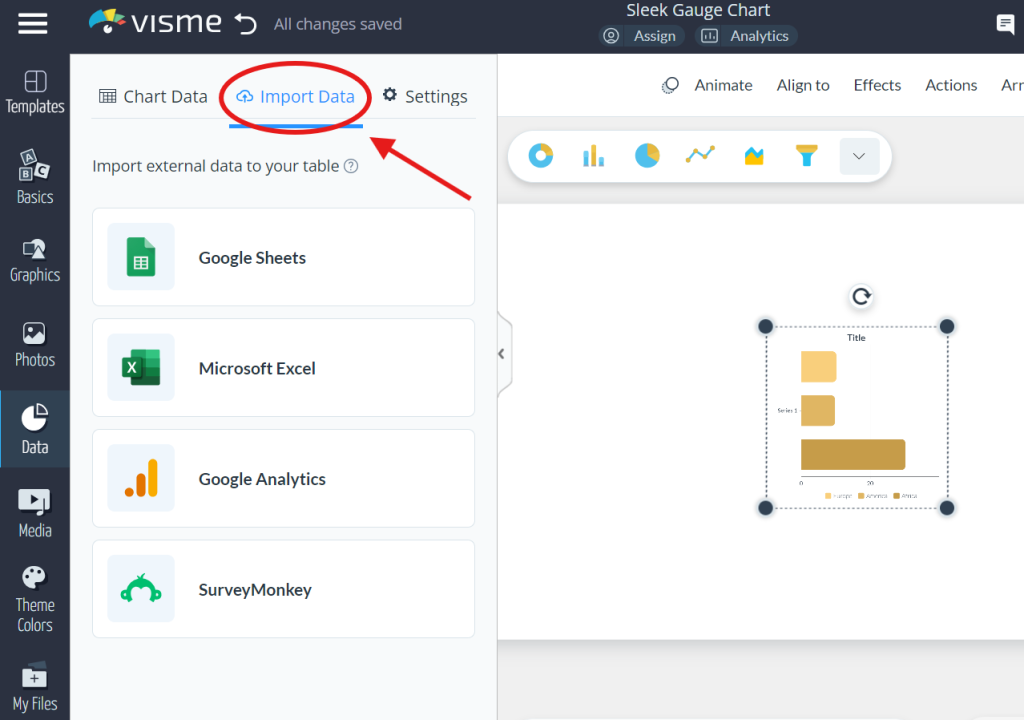
● Enter your data manually or via a transfer from other sources, including Google Sheets or
Excel.

● You can change the names and values of the data in the ‘Chart Data’ tab.
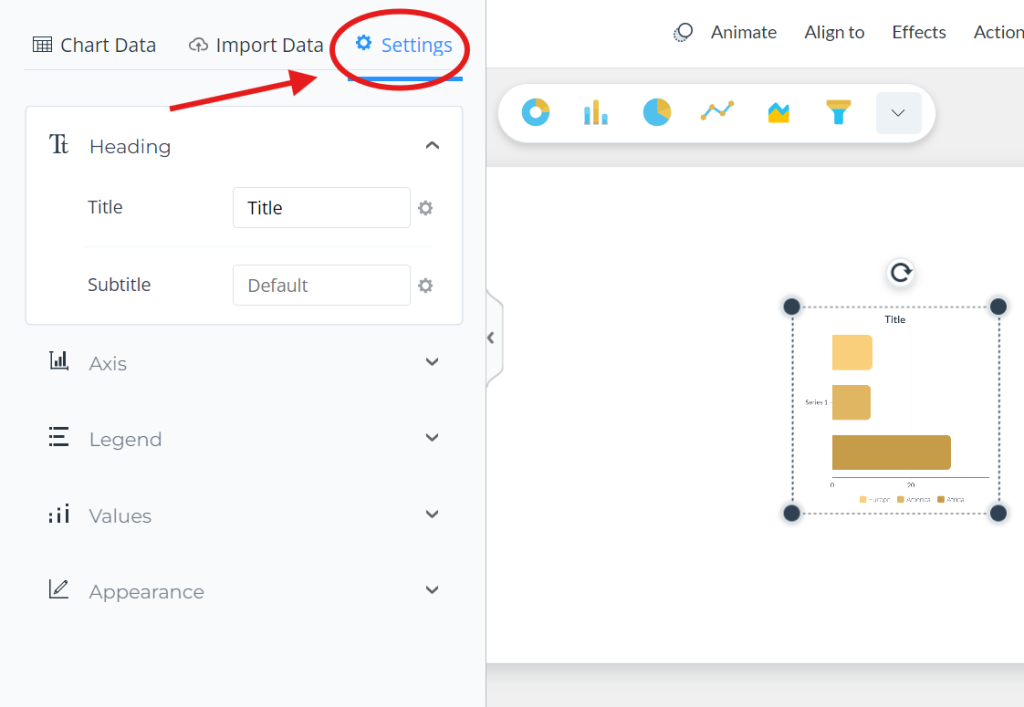
● Adjust settings such as headings, axes labels, legends, and the appearance of the chart.

● To alter the style of your chart or graph, choose from the options in the top menu.
● All charts and graphs are animated and interactive. These elements are also useful when you
share the project online for the engagement of the viewers.
● To continue the animation, you can share your project using the published URLs, embed the
animation on any websites, or directly export it in HTML 5.


