Visme’s premium plans are ideal for teams and organizations that require advanced
collaboration and analytics tools and the ability to analyze project performance in depth.
Collaboration Tools
● Real-Time Collaboration: Collaborators can edit a single document or file at a time, which
can be helpful in the case of group projects and work. The changes made are visible to all
the members of the group.
● Advanced Commenting: Get a better and faster way to leave comments and suggestions
about the project on the main screen to improve the work.
● Roles and Permissions: This means that users who are granted access into your workspace
also get limited to the roles they are assigned to. You can set permissions for who can work
on, view, or comment on projects, and make sure that if personal information is published, it
will be secure enough.
Analytics and Reporting
The Visme has great analysis options that help to measure activity and impact of created
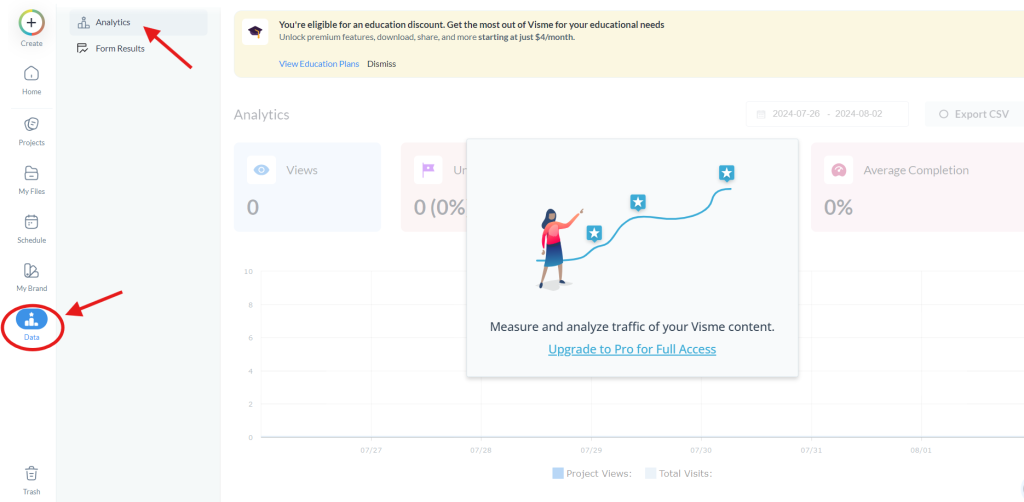
projects. You can view analytics by clicking on the ‘Data’ from the homepage and click on ‘Analytics’.
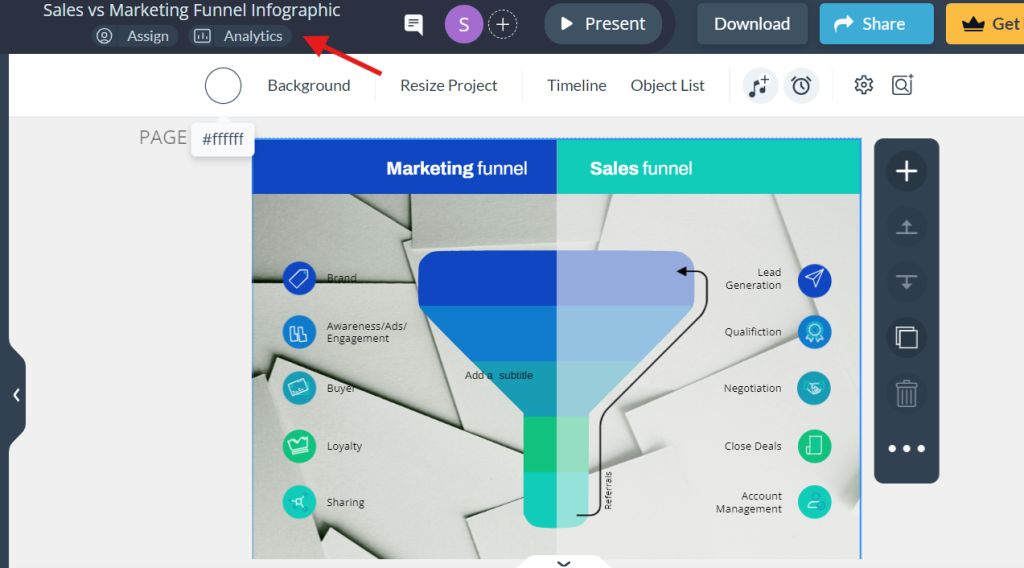
You can also view this feature from your editing page, below the name of the document.


You can also write on the project and find the ‘Analytics’ option in the dropdown
menu.
collaboration and analytics – Free Visme Tutorials/Download PDF and FlipBooks

This has many key features that includes:
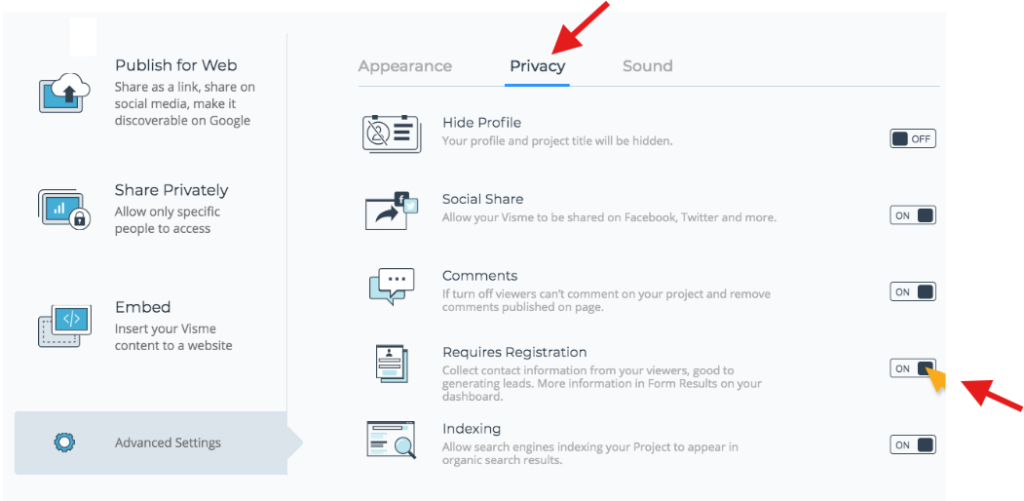
● Registration Form Results: Collect information such as name, email address, and
organization by turning on the ‘’Requires Registration’’ feature. Collected data can be
accessed from the form results tab under data of the Visme Dashboard.

● Tracking Traffic & Statistics: As for analytics and tracking, premium users receive
information about viewers’ activity and can get facts such as the number of views, clicks, and
time spent on every slide or page of the project. This feature, as indicated, is very helpful in
understanding how your content is being used and helps to improvise according to your
viewers. Admins can see all the projects in a workspace, and members have visibility to the
projects they are working on.
● Export & Filter Data: The form results and the analytics can be exported in the CSV format,
which offers more use in analysis and reporting. Data is presented in terms of time period,
and hence you can get information about how you want to use the data in analyzing the
information.
● Metric Definitions:
Views: The frequency of accessing a particular project.
Unique Visits: Number of unique visitors.
Average Time: Average time spent on the project.
Completion: Percentage of the project that is fully visible with full accessibility.
Activity: Number of projects that were viewed 100%.
Duration: Time taken by a visitor on a project.
IP Address & Location: Visitor’s location and IP address.
● Insightful Reports: Produce reports that assist you in evaluating how your content is doing.
These reports are vital for evidence-based operations in organizations and are used to plan
future tasks.
● Increased Storage: Storing features are available in most of the premium plans, with the
Starter plan having only 1GB, while the Enterprise plan users are provided between 10 and
25GB. This means that you can increase the number of projects and assets that can be
contained within your project.
● Deeper Analytics (Enterprise Feature): Visme presents a rich analytical toolkit as part of the
product. This feature enables you to get more detailed data, like who ever visited your
project, from which site or state they originated, and how many minutes or hours they spent
on each slide.


