What are infographics? How do we make use of it?
Infographics are visual tools used to present information, data, or knowledge in a clear and engaging
manner. They combine text, visuals, and data into one cohesive graphic, making it easier for viewers
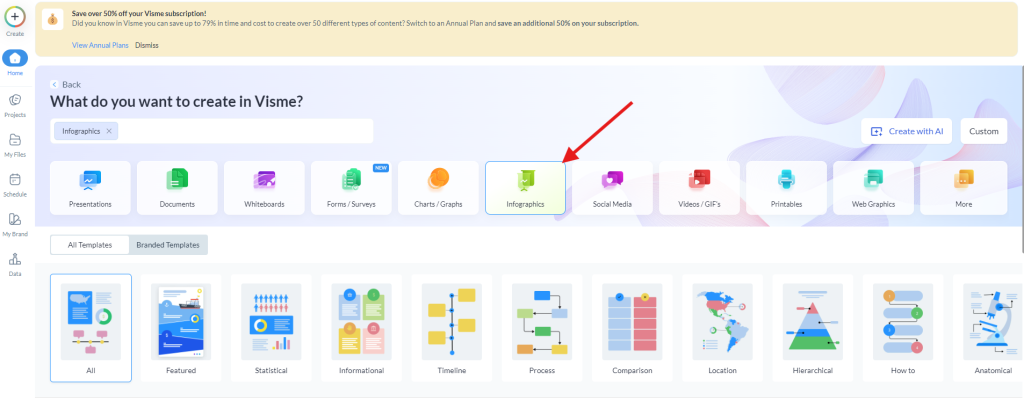
to understand complex information at a glance. Visme offers a variety of infographic templates that
cater to different types of data and purposes, such as featured, statistical, informational, timeline,
process, comparison, location, hierarchical, how-to, anatomical, resume, mind maps, roadmaps,
nonprofits, bite-sized, flowcharts, and diagrams. These templates help to communicate data-heavy
content in an attractive, easy format, making them ideal for presentations, reports, marketing
materials, and educational content. Using infographics in your projects can significantly increase
reader engagement by presenting key information in a visually appealing way.
Free Visme Tutorials/Download PDF and FlipBooks
All the infographics on Visme can be specifically designed for the following uses: Timeline
infographics are best used to display the chronological sequence, while comparison infographics are
helpful in showing the variance between two possibilities. Infographics are important to represent
ideas to the people, whether it is about a procedure to be followed or data statistics to be
represented. It is prominent to use in digital marketing, educational institutions, or in any business
to make the message convey to the targeted and potential clients.
How to Create an Infographic in Visme?
It’s easy and convenient to create an infographic in Visme with different options for customization.
In the course of this article, let me guide you on how to select the most appropriate infographics for
your work.
● Go to the dashboard and click on the Infographics button to get to various templates.

● These templates are grouped based on the different formats: featured, statistical, timeline,
comparison, process, and more. This makes it easy to select the format that suits the
content best.
● Clicking on any selection will give you a variety of templates that are aimed to reduce the
design time and efforts.
● However, you have the option to start a blank infographic page if you want to start from
scratch, but it is wise to select a design template if you want a quick solution.

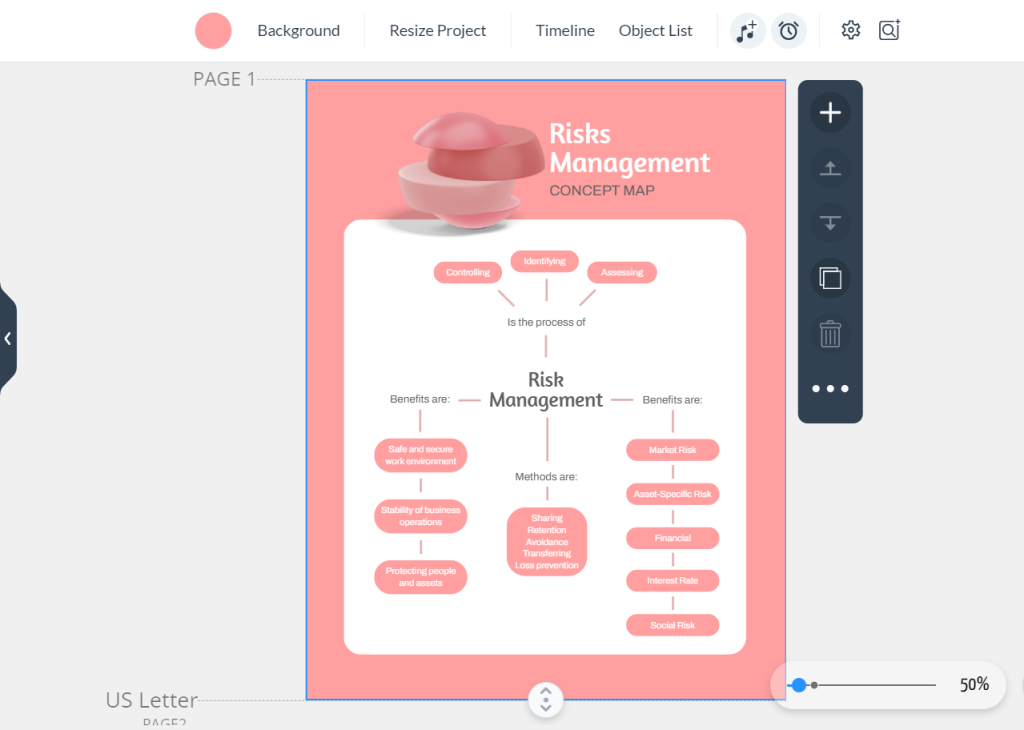
● After choosing a template, it becomes easier for you to work with the project by customizing
the template.
● All elements within the infographic can be adjusted—color, text, images, and icons—so that
the design suits your brand identity.
● You can directly edit the texts inside the text boxes by clicking the boxes, change the color of
an object, or replace it.
● In developing an infographic, Visme also provides the option of adding animations as a
media use in order to increase audience engagement.
● After creating an infographic, you can download and share the created infographic in various
formats, which turn the infographic into a versatile and useful tool for information
visualization.


